This is the last section of a four-part series that explores how population changes impact the Vermont economy. Previous posts explored the economic impacts of age composition, workforce participation and the age dependency ratios in Vermont. Part four considers how consumption rates impact the everyday economic life of Vermonters.
Lifetime Consumption Patterns
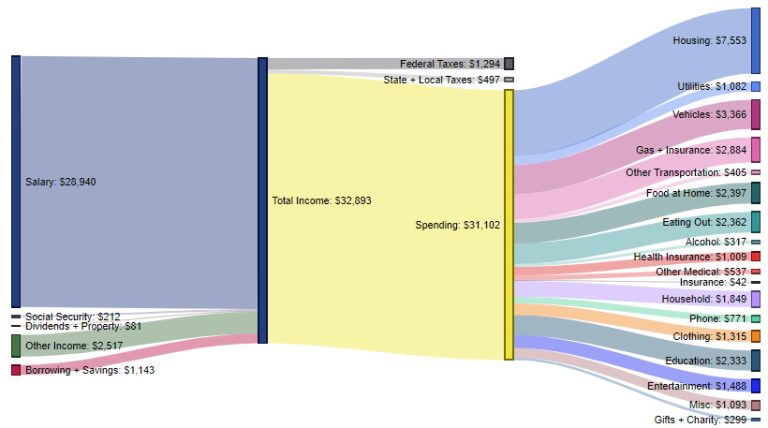
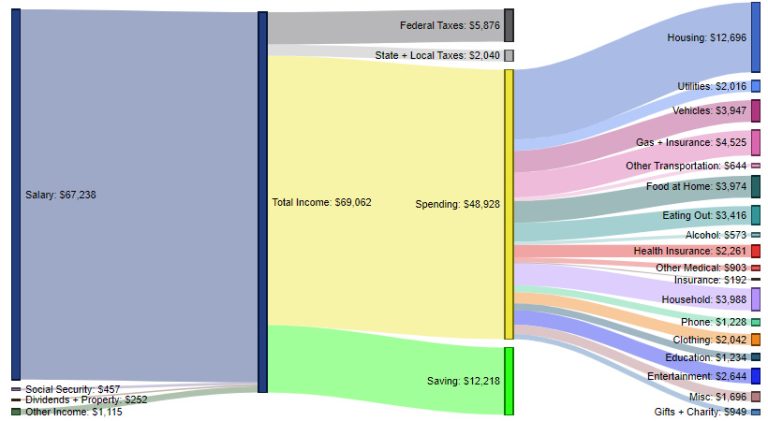
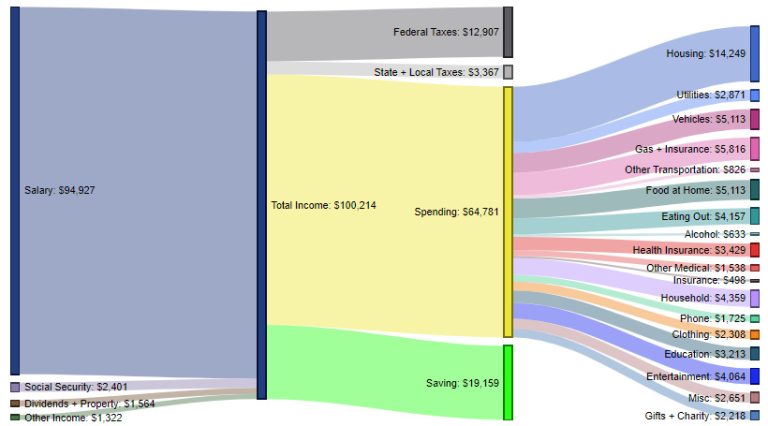
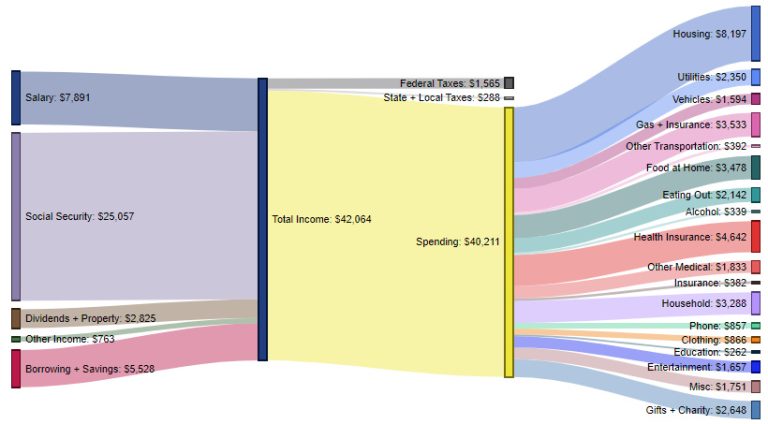
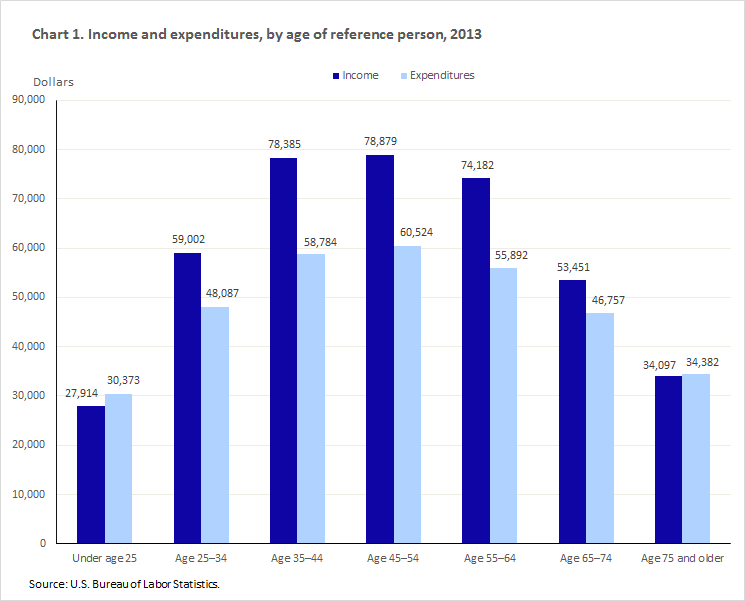
How we consume goods and services follows a predictable pattern based on our age. From age 25 to 54 average consumption increases. Consumption then tends to taper off as people consume less in their older years. A successful economy is built on a growing number of people aged 25-64 that are moving upwards in their consumption patterns. Thriving economies grow as people consume more each year. A population with a greater proportion of older workers and retirees tends to have excess capacity as it produces less to meet the lower needs for goods and services. These graphs featured by Visual Capitalist show how income and spending occur by different age groups:
Notice how housing is consistently the highest expense for all age groups. Vehicle expenses are often the second highest expense when younger but eventually gives way to health insurance as we age.
Here is another chart produced by the U.S. Bureau of Labor Statistics also shows typical high-level consumption patterns:
Trends show that once the working-age population decreases an economy starts slowing down. When the working age population growth in Japan slowed in the 1990s the economy weakened, and the same thing occurred after 2009 in Europe.
What This Means for Vermont
One reason the Vermont economy showed steady growth from 1970 through the early 2000s is due to the growing 25- to 64-year-old population. As this population became a larger share of the overall population there were upward consumption patterns. After the mid-2000s more Vermonters moved to the backside of the “consumption curve” so the consumption pattern flipped.
Housing and durable goods consumption tends to lead the way as engines of economic growth. For many people consumption for “big ticket items” peaks earlier in life. The younger cohort in Vermont is now dwarfed by the growth rate of the older population which pushes more people down the backside of their life-time consumption curve.
Other factors can impact consumption such as higher debt. Education and housing debt can disrupt typical consumption patterns of younger people by slowing homeownership and childbirth. This can push some consumption activity to later in life.
The combination of decreased consumption from an aging population in Vermont and higher debt loads suppressing consumption from younger Vermonters could negatively impact state revenues.
Looking Ahead
Many states find it difficult to increase consumption-based taxes as increases can suppress sales and may have a larger impact on lower wage earners. Lower labor force participation combined with an older demographic means less consumption of large-ticket items such as cars, refrigerators, and furniture. Consumption taxes provide support for both the Education and General Funds in Vermont. The Education Fund receives 100% of the Sales and Use and 25% of the Meals and Rooms revenue. The General Fund receives 75% of the Meals and Rooms revenue.
According to the 2021 Vermont Tax Structure Commission, consumption tax revenue in Vermont faces downward pressure in two ways:
- Lower overall income that lowers spending as people age
- Spending shifts from generally taxable goods to mostly not taxable services
One of the commission’s recommendations is to broaden the sales tax base to all consumer-level purchases of goods and services except health care and casual consumer-to-consumer transactions. They suggested using the gains to lower the sales tax rate to a level below the current average while continuing to eliminate the sales tax on business inputs. This would all be aimed to keep the Vermont economy growing during the next few decades as Vermont faces the consumption impacts of a rapidly aging population.
What do you think? – Do you agree with the commission’s recommendations, or do you have a different idea for how the state can adapt its revenue structure as our population ages and consumption patterns change?
